MMACE Paper: Random Forest for Blood-Brain Barrier
Show code cell source
import pandas as pd
import matplotlib.pyplot as plt
import seaborn as sns
import matplotlib as mpl
import rdkit, rdkit.Chem, rdkit.Chem.Draw
from rdkit.Chem.Draw import IPythonConsole
import numpy as np
import skunk
import mordred, mordred.descriptors
import exmol as exmol
from rdkit.Chem.Draw import rdDepictor
from sklearn.ensemble import RandomForestClassifier
from sklearn.model_selection import train_test_split
from sklearn.metrics import roc_auc_score, RocCurveDisplay

rdDepictor.SetPreferCoordGen(True)

IPythonConsole.ipython_useSVG = True
sns.set_context("notebook")
sns.set_style(
    "dark",
    {
        "xtick.bottom": True,
        "ytick.left": True,
        "xtick.color": "#666666",
        "ytick.color": "#666666",
        "axes.edgecolor": "#666666",
        "axes.linewidth": 0.8,
        "figure.dpi": 300,
    },
)
color_cycle = ["#1BBC9B", "#F06060", "#F3B562", "#6e5687", "#5C4B51"]
mpl.rcParams["axes.prop_cycle"] = mpl.cycler(color=color_cycle)
np.random.seed(0)
data = pd.read_csv("BBBP.csv")
data.head()
| num | name | p_np | smiles | |
|---|---|---|---|---|
| 0 | 1 | Propanolol | 1 | [Cl].CC(C)NCC(O)COc1cccc2ccccc12 |
| 1 | 2 | Terbutylchlorambucil | 1 | C(=O)(OC(C)(C)C)CCCc1ccc(cc1)N(CCCl)CCCl |
| 2 | 3 | 40730 | 1 | c12c3c(N4CCN(C)CC4)c(F)cc1c(c(C(O)=O)cn2C(C)CO... |
| 3 | 4 | 24 | 1 | C1CCN(CC1)Cc1cccc(c1)OCCCNC(=O)C |
| 4 | 5 | cloxacillin | 1 | Cc1onc(c2ccccc2Cl)c1C(=O)N[C@H]3[C@H]4SC(C)(C)... |
def largest_mol(smiles):
  # remove ions from SMILES by getting the largest molecule part
  ss = smiles.split('.')
  ss.sort(key = lambda a: len(a))
  return ss[-1]

# make object that can compute descriptors
calc = mordred.Calculator(mordred.descriptors, ignore_3D=True)
# make subsample from pandas df
molecules = [rdkit.Chem.MolFromSmiles(largest_mol(smi)) for smi in data.smiles]

# the invalid molecules were None, so we'll just
# use the fact the None is False in Python
valid_mol_idx = [bool(m) for m in molecules]
valid_mols = [m for m in molecules if m]
try:
    raw_features = pd.read_pickle("raw_features.pb")
except FileNotFoundError as e:
    raw_features = calc.pandas(valid_mols, nproc=8, quiet=True)
    raw_features.to_pickle("raw_features.pb")
labels = data[valid_mol_idx].p_np
# remove missing mordred descriptors, they don't show up as NaN
numeric_features = raw_features.select_dtypes(include=['number'])
fs = numeric_features.std(axis=0)
nonzero_cols = fs != 0 # only keep columns with non-zero std
features_select = numeric_features.columns[nonzero_cols]

features = raw_features[features_select]
fm = features.mean()
fs = features.std()

def feature_convert(f):
    f -= fm
    f /= fs
    return f

features = feature_convert(features)
X_train, X_test, y_train, y_test = train_test_split(
features, labels, test_size=0.2, shuffle=True
)
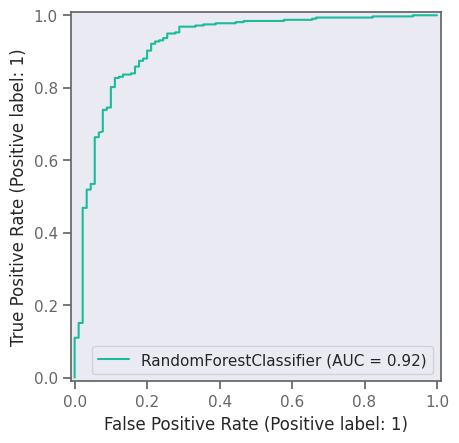
clf = RandomForestClassifier(max_depth=8, random_state=0)
clf.fit(X_train, y_train)
predicted = clf.predict(X_test)
print("AUC", roc_auc_score(y_test, clf.predict_proba(X_test)[:, 1]))
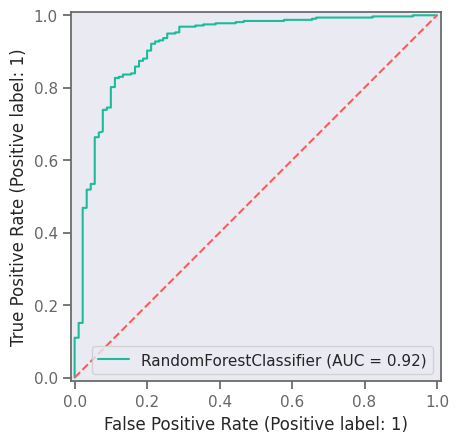
plt.figure(figsize=(4, 3), dpi=300)
roc_display = RocCurveDisplay.from_estimator(clf, X_test, y_test)
roc_display.plot()
plt.plot([0, 1], [0, 1], linestyle="--")
plt.savefig("RF-ROC.png")
AUC 0.920946890286513
<Figure size 1200x900 with 0 Axes>
def model_eval(smiles, _=None):
    molecules = [rdkit.Chem.MolFromSmiles(largest_mol(smi)) for smi in smiles]
    # input wrangling. Get some weird values from weird smiles
    raw_features = calc.pandas(molecules, nproc=8, quiet=True)
    features = raw_features[features_select]
    features = feature_convert(features)
    labels = clf.predict(features)
    return labels
    # return np.random.choice([True, False], size=labels.shape)


labels = model_eval(data.iloc[valid_mol_idx].smiles.values[:100])
example_neg = data.iloc[valid_mol_idx].smiles.values[np.argmin(labels)]
example_pos = data.iloc[valid_mol_idx].smiles.values[np.argmax(labels)]
example_neg_y, example_pos_y = model_eval([example_neg, example_pos])
print("neg:", example_neg, "\npos:", example_pos)
print(example_neg_y, example_pos_y)
neg: CCN1CCN(C(=O)N[C@@H](C(=O)N[C@H]2[C@H]3SCC(=C(N3C2=O)C(O)=O)CSc4nnnn4C)c5ccc(O)cc5)C(=O)C1=O
pos: [Cl].CC(C)NCC(O)COc1cccc2ccccc12
0 1
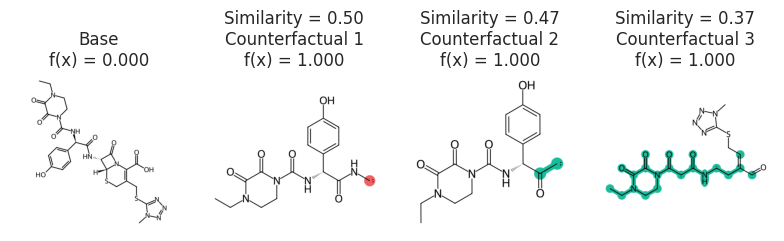
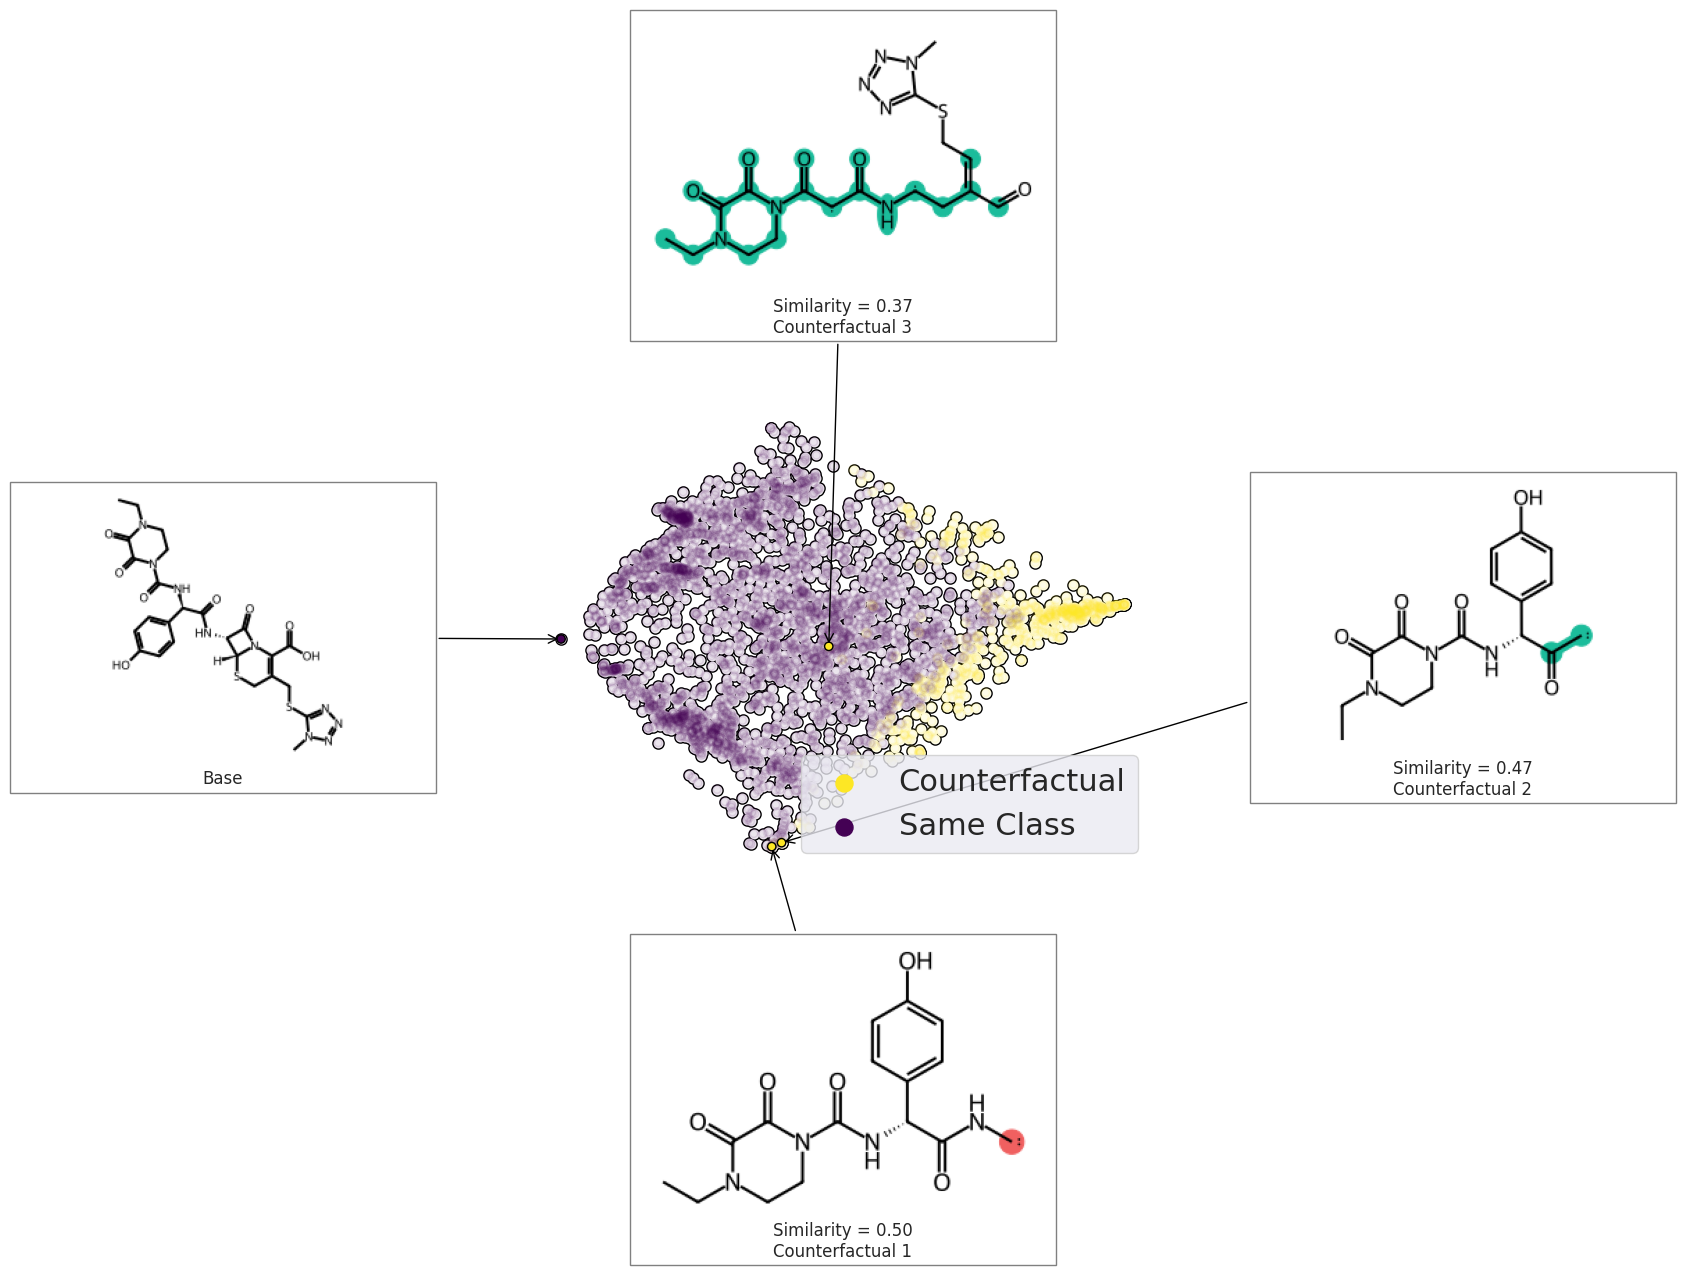
space = exmol.sample_space(example_neg, model_eval, quiet=True)
exps = exmol.cf_explain(space)
print(exps)
[Example(smiles='CCN1CCN(C(=O)N[C@@H](C(=O)N[C@H]2[C@H]3SCC(CSC4=NN=NN4C)=C(C(O)=O)N3C2=O)C2=CC=C(O)C=C2)C(=O)C1=O', selfies='[C][C][N][C][C][N][Branch2][Branch1][O][C][=Branch1][C][=O][N][C@@H1][Branch2][Ring2][#Branch1][C][=Branch1][C][=O][N][C@H1][C@H1][S][C][C][Branch1][O][C][S][C][=N][N][=N][N][Ring1][Branch1][C][=C][Branch1][=Branch1][C][Branch1][C][O][=O][N][Ring1][P][C][Ring2][Ring1][Ring1][=O][C][=C][C][=C][Branch1][C][O][C][=C][Ring1][#Branch1][C][=Branch1][C][=O][C][Ring2][Ring2][=Branch2][=O]', similarity=1.0, yhat=np.int64(0), index=0, position=array([-11.19892737, -0.25004298]), is_origin=True, cluster=np.int64(-1), label=None, descriptors=None), Example(smiles='[CH]NC([C@H](NC(N1CCN(CC)C(=O)C1=O)=O)C1=CC=C(O)C=C1)=O', selfies='[C@H1][Branch2][Ring2][O][N][C][Branch2][Ring2][Branch1][C@H1][Branch2][Ring1][=Branch1][N][C][Branch1][P][N][C][C][N][Branch1][=Branch2][C][Branch1][Branch1][C][Ring1][=Branch1][=O][=O][C][C][=O][C][C][=C][C][Branch1][C][O][=C][C][=Ring1][#Branch1][=O][=Branch3][C@@H1][N][Branch2][Ring1][O][C][=Branch2][Ring1][C][=C][Branch1][O][C][S][C][=N][N][=N][N][Ring1][Branch1][C][C][S][Ring1][=C][C][Branch1][C][O][=O][C][Ring2][Ring2][O][=O]', similarity=0.49606299212598426, yhat=np.int64(1), index=1070, position=array([-1.60239784, -5.36307076]), is_origin=False, cluster=np.int64(29), label='Counterfactual 1', descriptors=None), Example(smiles='[CH]C([C@@H](C1=CC=C(O)C=C1)NC(=O)N1C(=O)C(=O)N(CC)CC1)=O', selfies='[C@H1][#Branch3][Ring2][N][N][C][Branch2][Ring2][=Branch1][C@@H1][Branch1][N][C][=C][C][=C][Branch1][C][O][C][=C][Ring1][#Branch1][N][C][=Branch1][C][=O][N][C][Branch1][=C][C][Branch1][#Branch2][N][Branch1][Branch1][C][C][Ring1][=Branch1][C][C][=O][=O][=O][C@H1][S][C][C][Branch1][O][C][S][C][=N][N][=N][N][Ring1][Branch1][C][Branch1][=Branch1][C][=Branch1][C][=O][O][N][Ring1][P][C][Ring2][Ring2][O][=O]', similarity=0.47244094488188976, yhat=np.int64(1), index=1357, position=array([-1.1544709 , -5.26738576]), is_origin=False, cluster=np.int64(-1), label='Counterfactual 2', descriptors=None), Example(smiles='C(SC1=NN=NN1C)C=C(C=O)C[CH]NC(=O)[CH]C(=O)N1C(=O)C(=O)N(CC)CC1', selfies='[C][Branch1][#Branch2][S][C][=N][N][=N][N][Ring1][Branch1][C][C][=C][Branch1][=Branch1][=Branch1][C][=O][O][N][C][Branch2][Branch1][=Branch2][C@@H1][Branch2][Ring2][N][N][C][=Branch1][C][=O][C@H1][Branch2][Branch2][N][C][=Branch1][C][=O][N][C][Branch1][=C][C][=Branch1][C][=O][N][Branch1][Ring1][C][C][C][C][Ring1][=Branch2][=O][C][C][=C][C][Branch1][C][O][=C][C][=Ring1][#Branch1][C@H1][Ring2][Ring1][N][S][C][Ring2][Ring2][Ring1][=O]', similarity=0.36666666666666664, yhat=np.int64(1), index=2245, position=array([ 0.99564659, -0.4307916 ]), is_origin=False, cluster=np.int64(64), label='Counterfactual 3', descriptors=None)]
fkw = {"figsize": (8, 6)}
mpl.rc("axes", titlesize=12)
exmol.plot_cf(exps, figure_kwargs=fkw, mol_size=(450, 400), nrows=1)

plt.savefig("rf-simple.png", dpi=180)
svg = exmol.insert_svg(exps, mol_fontsize=14)
with open("svg_figs/rf-simple.svg", "w") as f:
    f.write(svg)
font = {"family": "normal", "weight": "normal", "size": 22}
exmol.plot_space(
    space,
    exps,
    figure_kwargs=fkw,
    mol_size=(300, 200),
    offset=0,
    cartoon=True,
    rasterized=True,
)
plt.scatter([], [], label="Counterfactual", s=150, color=plt.get_cmap("viridis")(1.0))
plt.scatter([], [], label="Same Class", s=150, color=plt.get_cmap("viridis")(0.0))
plt.legend(fontsize=22)
plt.tight_layout()
plt.savefig("rf-space.png", dpi=180)
svg = exmol.insert_svg(exps, mol_fontsize=14)
with open("svg_figs/rf-space.svg", "w") as f:
    f.write(svg)
skunk.display(svg)
/tmp/ipykernel_2860/1307271508.py:14: UserWarning: Tight layout not applied. The left and right margins cannot be made large enough to accommodate all Axes decorations.
  plt.tight_layout()

Schematic Plots
from rdkit.Chem import MolFromSmiles as smi2mol
from rdkit.Chem import MolToSmiles as mol2smi
from rdkit.Chem.Draw import MolToImage as mol2img

dos = rdkit.Chem.Draw.MolDrawOptions()
dos.useBWAtomPalette()
# dos.minFontSize = fontsize
img = mol2img(smi2mol(exps[0].smiles), options=dos)
# img.save("rf-schem-1.png")
fkw = {"figsize": (8, 4)}
font = {"family": "normal", "weight": "normal", "size": 22, "dpi": 300}
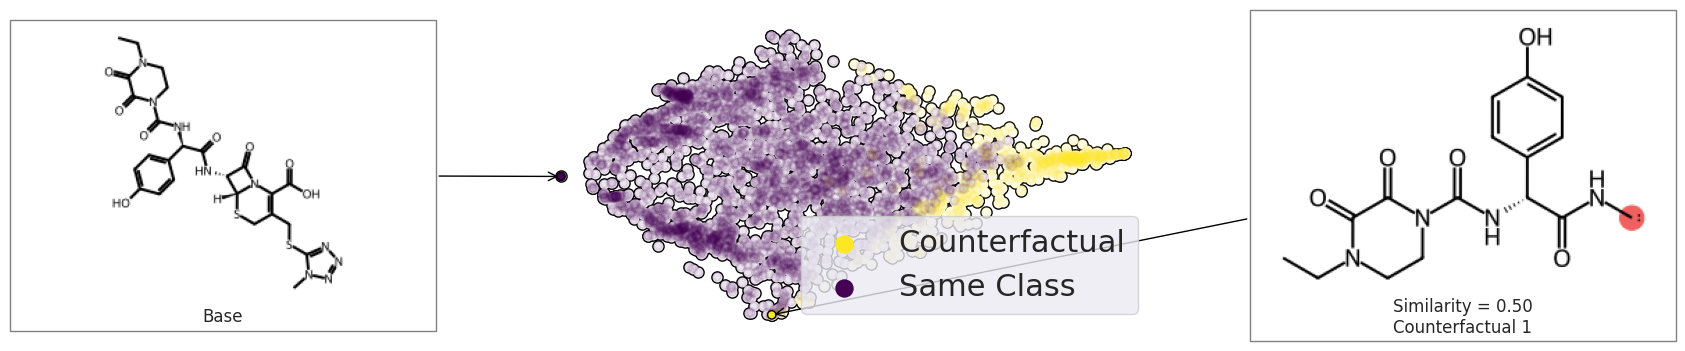
exmol.plot_space(
space, exps[:2], figure_kwargs=fkw, mol_size=(300, 200), offset=0, cartoon=True
)
plt.scatter([], [], label="Counterfactual", s=150, color=plt.get_cmap("viridis")(1.0))
plt.scatter([], [], label="Same Class", s=150, color=plt.get_cmap("viridis")(0.0))
plt.legend(fontsize=22)
plt.tight_layout()
plt.savefig("rf-schem-3.png", bbox_inches="tight", dpi=180)
svg = exmol.insert_svg(exps[:2], mol_fontsize=10)
with open("rf-scheme.svg", "w") as f:
f.write(svg)
skunk.display(svg)
/tmp/ipykernel_2860/4183877770.py:9: UserWarning: Tight layout not applied. The left and right margins cannot be made large enough to accommodate all Axes decorations.
  plt.tight_layout()

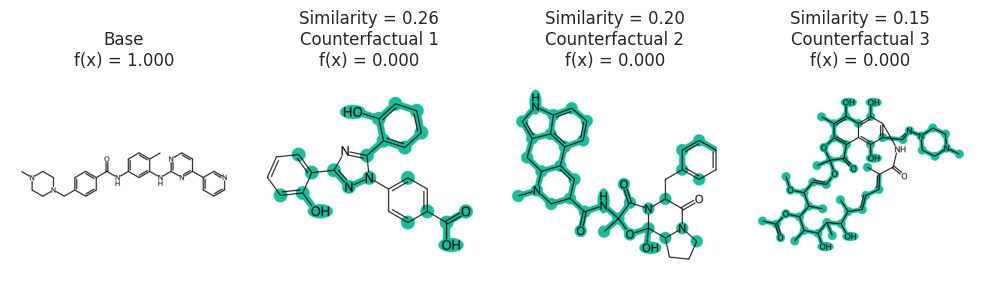
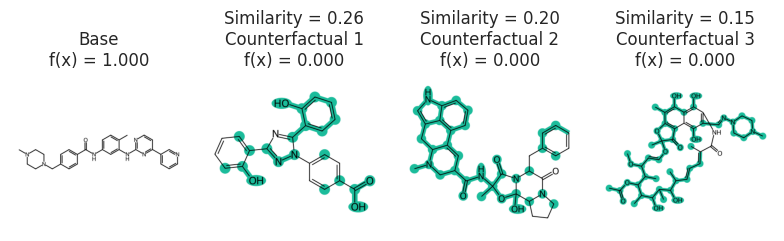
Chemed
cspace = exmol.sample_space(
    "Cc1ccc(cc1Nc2nccc(n2)c3cccnc3)NC(=O)c4ccc(cc4)CN5CCN(CC5)C",
    model_eval,
    preset="medium",
    quiet=True,
)
kws = {"num_samples": 1500}
zspace = exmol.sample_space(
    "Cc1ccc(cc1Nc2nccc(n2)c3cccnc3)NC(=O)c4ccc(cc4)CN5CCN(CC5)C",
    model_eval,
    preset="chemed",
    method_kwargs=kws,
    quiet=True,
)
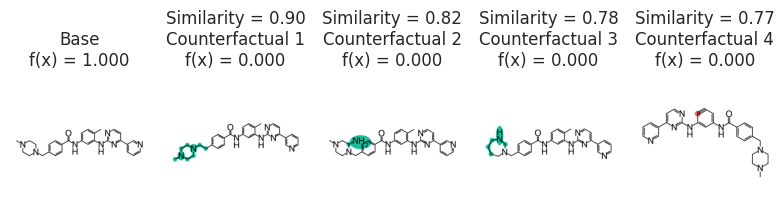
### Gleevec molecule
exps = exmol.cf_explain(zspace)
fkw = {"figsize": (8, 6)}
mpl.rc("axes", titlesize=12)
exmol.plot_cf(exps, figure_kwargs=fkw, mol_size=(450, 400), nrows=1)
fkw = {"figsize": (8, 6)}
mpl.rc("axes", titlesize=12)
cfs = exmol.cf_explain(cspace, nmols=4)
exmol.plot_cf(cfs, figure_kwargs=fkw, mol_fontsize=26, mol_size=(400, 400), nrows=1)
plt.savefig("gleevec-cs.png", bbox_inches="tight", dpi=180)
svg = exmol.insert_svg(cfs)
with open("svg_figs/gleevec-cs.svg", "w") as f:
    f.write(svg)
fkw = {"figsize": (8, 6)}
mpl.rc("axes", titlesize=12)
exmol.plot_cf(exps, figure_kwargs=fkw, mol_size=(450, 400), nrows=1)

plt.savefig("rf-simple.png", dpi=180)
svg = exmol.insert_svg(exps, mol_fontsize=14)
with open("svg_figs/gleevec-simple.svg", "w") as f:
    f.write(svg)
fkw = {"figsize": (10, 6)}
mpl.rc("axes", titlesize=12)
exmol.plot_cf(exps, figure_kwargs=fkw, mol_size=(450, 400), nrows=1)

zexps = exmol.cf_explain(zspace, nmols=5)